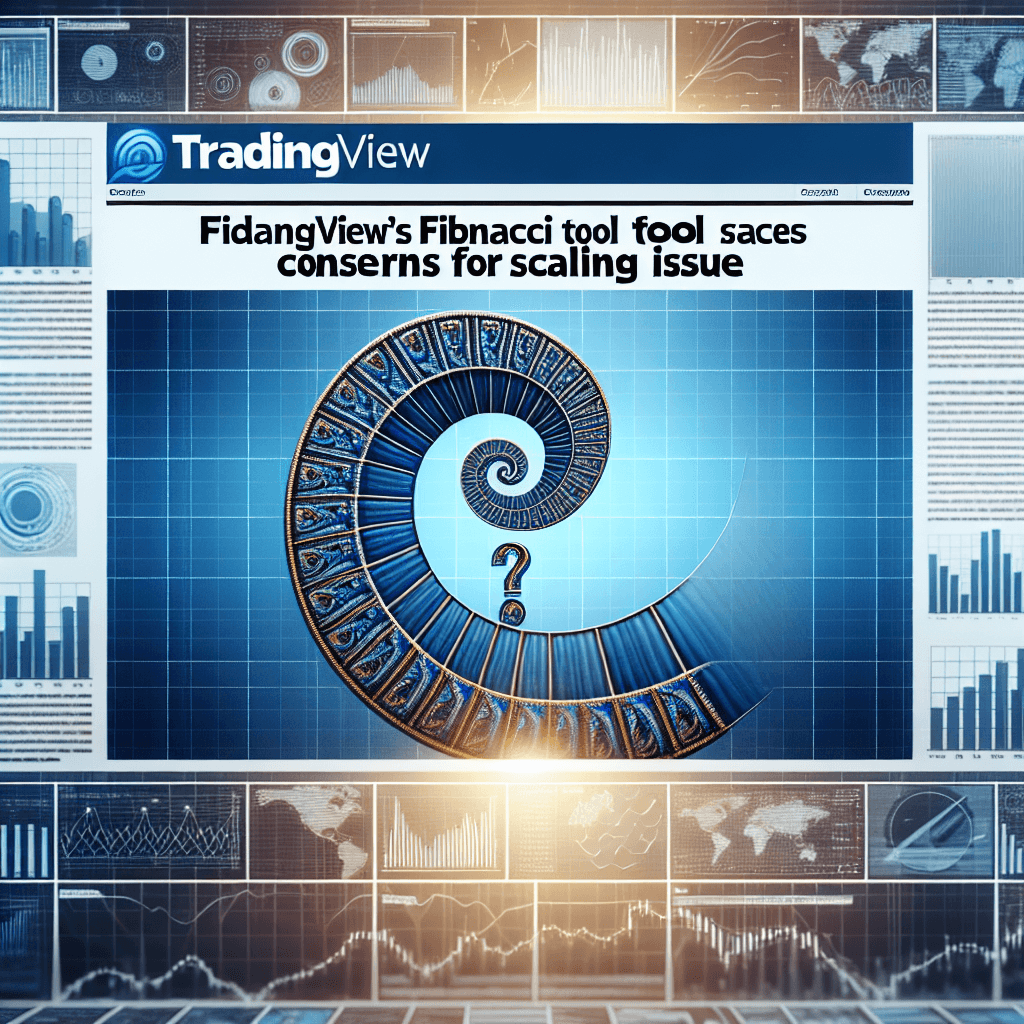
TradingView’s Fibonacci Tool Faces Concerns Over Scaling Issue
Update: TradingView’s CTO recently told Cointelegraph that the reports of a bug were inaccurate and the Twitter user has partially withdrawn his earlier claims that the tool is broken.
Background: Claim of a Five-Year-Old Bug
On June 13, self-styled Elliott wave specialist @cryptoteddybear tweeted that TradingView’s Fibonacci retracement tool miscalculates key levels when used on logarithmic price charts. In a follow-up video demonstration, he showed how the tool applies linear percentage differences to log-scaled data, distorting support and resistance projections.
Technical Deep Dive: Linear vs. Logarithmic Scaling
Fibonacci retracement lines—typically drawn at 23.6%, 38.2%, 50%, 61.8% and 78.6%—help chartists anticipate pullback levels. On a linear price axis, the calculation is straightforward:
- High minus low = price range
- Multiply range by each Fib ratio
- Subtract result from the high (for downward retracements) or add to the low (for upward retracements)
But when a chart uses logarithmic scaling, equal vertical distances represent equal percentage changes rather than absolute price differences. To compute accurate Fib levels on a log axis, software must:
- Convert prices to their natural logarithms (ln)
- Apply Fib ratios in log space: ln(level) = ln(low) + FibRatio × [ln(high) – ln(low)]
- Exponentiate the result: level = exp[ln(level)]
According to @cryptoteddybear’s tests, TradingView’s tool skipped the logarithmic transform and treated logged axis values as if they were linear, leading to systematic errors on long-term or parabolic charts.
Impact on Traders and Elliott Wave Practitioners
Elliott wave analysts rely on precise Fib ratios to validate wave counts and project wave extensions. An error of even 1–2% can shift key confluence zones, potentially invalidating an entire wave count. TradingView, with over 30 million monthly users, serves both retail and institutional chartists who may have unwittingly based entries and exits on misaligned levels.
Company Response and Timeline
“Thank you @tradingview for finally taking this issue seriously.” — @cryptoteddybear
Historical posts on TradingView’s GetSatisfaction forum date back to November 2014, with users noting the same discrepancy. In June 2017, an official reply acknowledged a “planned task to fix this,” yet no visible update followed until mid-2019, when the company announced an investigation. The recent comment by TradingView’s CTO categorically denies a software defect, suggesting a misinterpretation of functionality by the user.
Comparative Analysis: How Other Platforms Handle Log-Scale Fib Calculations
- MetaTrader 5: Applies log-space calculations when the chart is set to logarithmic; results align with textbook Fib levels.
- Thinkorswim (TD Ameritrade): Offers an option to toggle between linear and log Fib tools explicitly.
- TrendSpider: Automatically detects axis scaling and adjusts Fib math accordingly, with published API documentation.
Expert Opinions
“Precision in retracement levels is critical for any wave-based strategy. Traders should verify tools across multiple platforms until the vendor clarifies the computation method,” says Jane Russell, CMT, a veteran technical strategist. “Even small scale distortions can cascade into incorrect risk-reward assessments,” adds Dr. Alex Kerr, algorithmic trading researcher at the University of Chicago.
Workarounds and Best Practices
- Manually calculate log-space Fib levels using spreadsheet formulas (ln, exponentiation).
- Cross-reference with a secondary charting service when analyzing long-term trends.
- Temporarily switch to linear scaling for Fib overlays if consistency is preferred over axis style.
Conclusion
While TradingView’s official stance asserts no bug exists, the debate highlights the importance of transparency in technical-analysis software. Chartists should remain vigilant, validate critical tool behavior, and consult multiple sources when trading off key Fibonacci levels.