Dogecoin’s Technical Challenge: Examining the Descending Triangle
Dogecoin (DOGE) finds itself at a pivotal moment in its trading cycle, as price movements continue to consolidate within a descending triangle pattern, signaling an increase in bearish sentiment. This meme-inspired cryptocurrency has been exhibiting a phase of low volatility, tightly coiling price action—a hallmark of market indecision that frequently heralds a significant breakout or breakdown.
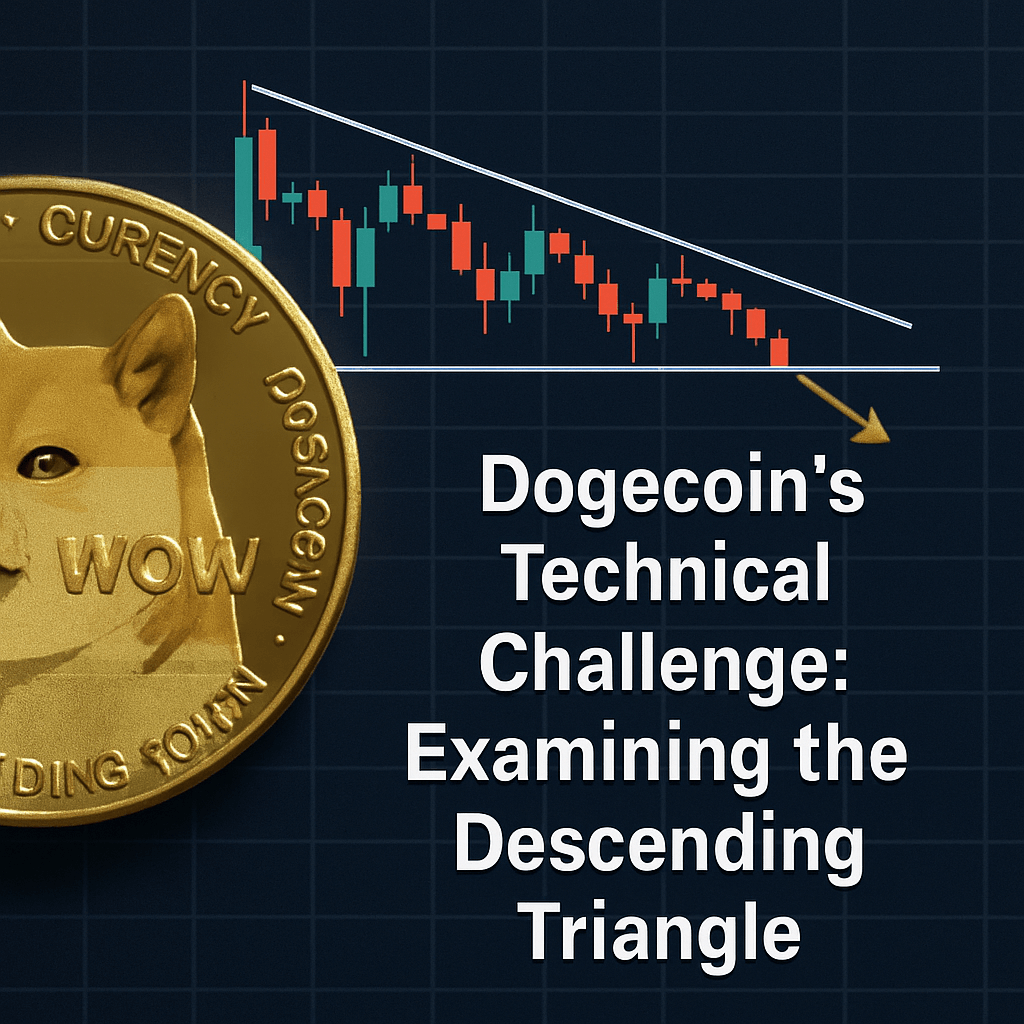
Technical Analysis of the Descending Triangle
Market analyst Thomas Anderson recently highlighted on platform X that “DOGE is consolidating within a descending triangle pattern on the M30 timeframe.” This specific chart formation is typically regarded as a bearish continuation pattern, marked by the establishment of a horizontal support base with successive lower highs negotiating downwards from above. As Dogecoin’s price descends deeper into this triangular structure, the likelihood of a decisive breakout—whether upward or downward—intensifies with each contraction.
Key Resistance Levels and Their Impacts
Anderson elaborated that DOGE is presently encountering significant resistance near the $0.19998 mark. This critical level is not only delineated by the upper trendline of the descending triangle but is also supported by the 200-period moving average (MA), which acts as a dynamic resistance. The intersection of these factors suggests that breaking above this threshold may prove challenging for bullish traders in the near term.
- The 200-period MA offers a historical average that traders often rely on for determining market direction.
- Should DOGE breach the $0.19998 resistance decisively, it could ignite a short-term bullish momentum, targeting higher price levels.
- On the contrary, a failure to move above this resistance may amplify bearish pressures, pushing the cryptocurrency closer to the lower support of the triangle at approximately $0.19010.
Momentum Analysis and Future Projections
The convergence of price action near the apex of the descending triangle is noteworthy, as momentum indicators suggest a potential weakening. The 1-hour chart provides further evidence of this consolidation phase, demonstrating a clear compression of price action within the triangle pattern. Such setups typically culminate in explosive movements once market participants commit to a direction.
The Role of Market Sentiment
Investor sentiment surrounding Dogecoin is another critical factor to monitor. Recent trends in social media discussions and trading volumes indicate fluctuating interest levels, often paralleling the cryptocurrency’s price movements. The meme-driven nature of DOGE can lead to volatile spikes in both public interest and market activity, thereby complicating traditional technical analysis.
Additional Technical Considerations
In addition to the triangle formation and resistance levels, traders should also assess volume characteristics. A confirmed breakout above the $0.19998 level, particularly one supported by substantial trading volume, could signify a shift in sentiment and mark a potential reversal of the bearish intricacies within the triangle.
Conversely, should Dogecoin experience a decline towards the lower support of $0.19010, renewed selling pressure may manifest, potentially resulting in a breach of this level. Such an outcome would likely validate the bearish triangle pattern and lead traders to adjust their positions accordingly.
Conclusion: Anticipating Dogecoin’s Next Move
The situation surrounding Dogecoin remains fluid, with the market at a critical inflection point. As consolidation intensifies within the descending triangle, traders must remain vigilant for signs of either bullish breakout or bearish breakdown. Ultimately, the cryptocurrency’s trajectory will be dictated by market sentiment, trading volumes, and the ability of buyers to defend pivotal levels.
Featured image: Getty Images, chart source: Tradingview.com
Source: newsbtc