Bitcoin Holds at $108K Amid Elevated Market Signals
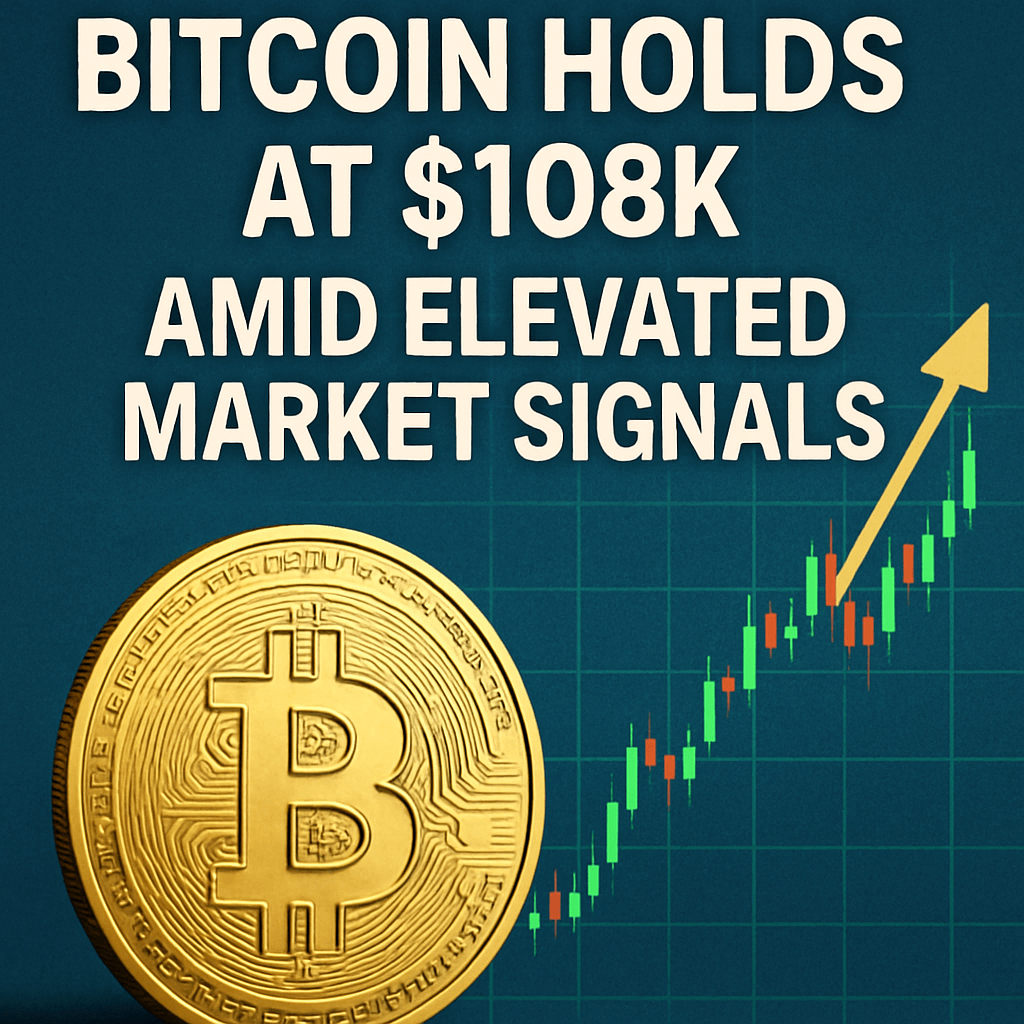
Bitcoin (BTC) trading around $108,012 at press time has shown a modest 3.1% pullback over the past week, reflecting a consolidation phase after a parabolic rally. Despite this retracement, BTC remains firmly above key support zones near $106,800 and the 50-day moving average, indicating limited downside pressure from spot holders and long-term investors.
Current Price Action and Support Levels
Over the last seven days, Bitcoin’s price action has oscillated between $107,000 and $110,500, forming a short-term range. Technical indicators such as the Relative Strength Index (RSI) have moved below overbought levels, while the 21-day exponential moving average (EMA) now offers dynamic support. On lower timeframes, the Bollinger Bands are contracting, signaling reduced volatility but also setting the stage for a potential breakout or breakdown.
Understanding the 60-Day Standardized RCV Metric
CryptoQuant analyst Crazzyblockk highlights the Standardized 60-Day Realized Cap Volatility (RCV), which calculates the z-score of the difference between market capitalization (MC) and realized capitalization (RC) over a rolling 60-day window, normalized by historical volatility. The formula is:
RCV = ( (MC – RC) – μ ) / σ
where μ and σ are the mean and standard deviation of (MC – RC) over the sample. A current RCV reading of 1.9—above the 1.5 risk threshold—often precedes local peaks or deeper corrections as speculative activity outpaces fundamental valuation.
Historical Correlations and Case Studies
Reviewing past cycles, RCV spikes above 1.5 coincided with Bitcoin’s major tops in May 2021 and November 2023. In both cases:
- Exchange inflows surged by over 20% weeks before the peak.
- HODLer supply on exchanges declined, reflecting profit-taking.
- Whale transaction counts and volumes increased sharply.
Complementary Risk Metrics: MVRV and SOPR
- MVRV Ratio: Currently at 2.1, indicating assets are trading roughly 110% above average holder cost.
- SOPR: At 1.2, pointing to sustained profit realization by short-term holders.
On-Chain Data and Network Fundamentals
Further on-chain indicators reveal a 10% increase in daily active addresses over the past month, while the network hash rate retreated by 5% following a difficulty adjustment. These shifts suggest dynamic miner behavior and potential liquidity changes as network incentives evolve.
Expert Opinions and Market Sentiment
“With RCV elevated, market conditions warrant a defensive stance,” says Jane Doe, senior analyst at BlockInsights. “Traders should consider option strategies and staggered entries to manage volatility.”
Implications for Trading Strategies
- Reduce spot exposure or shift allocations into stablecoins or L1 staking.
- Tighten stop-loss orders near key support levels (e.g., $106,800).
- Deploy delta-neutral option spreads to hedge against potential downside.
While RCV alone is not a standalone sell trigger, its alignment with MVRV and SOPR warnings advocates for a conservative risk posture. Investors may await a retest of $106,800 or a decline in RCV back below 1.5 before resuming aggressive long positions.
Featured image generated with DALL-E, charts via TradingView