Bitcoin RSI Below 30: Implications for Price Trends
Recent data indicate that the 14-day Relative Strength Index (RSI) for Bitcoin (BTC) has dropped into the oversold region, raising questions about potential price movements in the coming weeks.
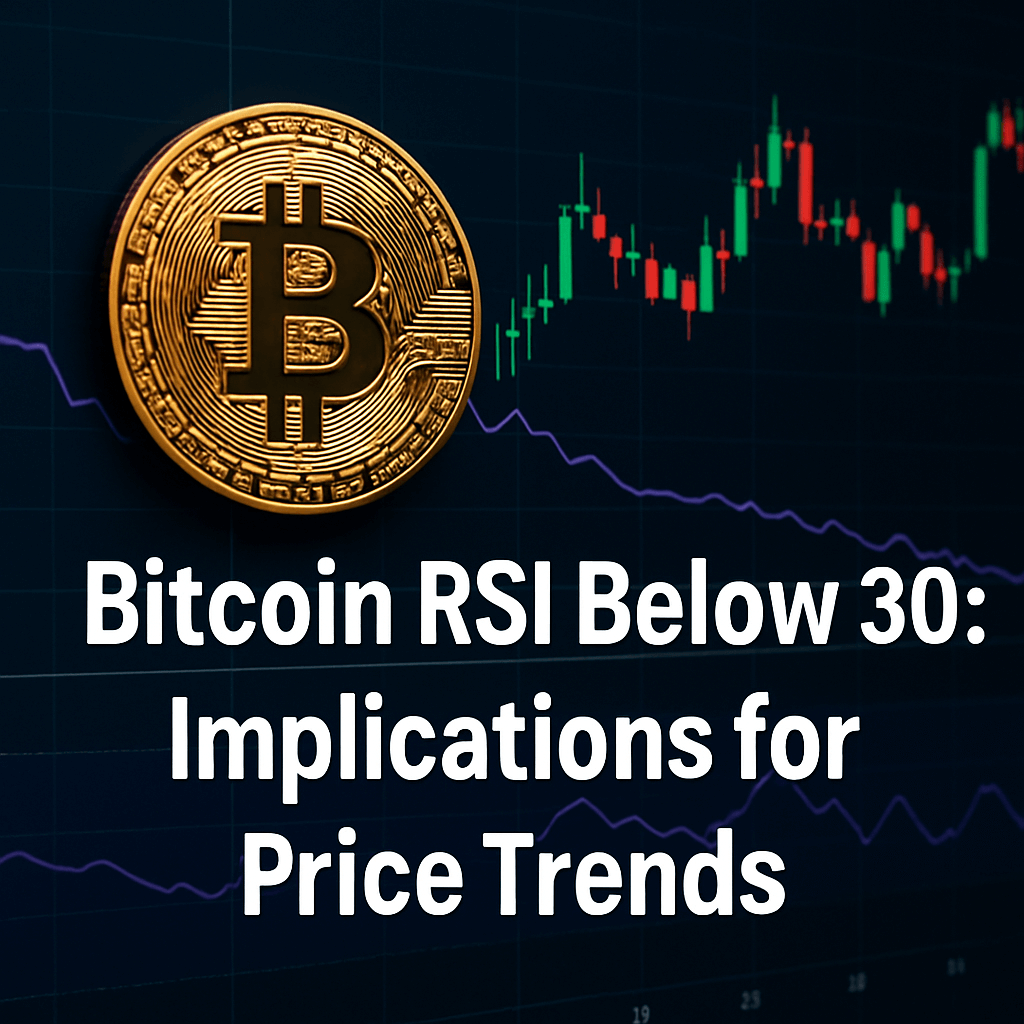
Understanding Bitcoin’s RSI
The RSI is a widely used momentum oscillator in technical analysis (TA) that measures the speed and amplitude of price changes over a specific period, in this case, 14 days. The index ranges from 0 to 100, where values above 70 typically signal that an asset is overbought and may be due for a price correction. Conversely, values below 30 indicate that an asset could be oversold, suggesting it may be undervalued at current prices.
Current Market Conditions
Analyst Axel Adler Jr shared on X that Bitcoin’s RSI has recently plunged below the critical threshold of 30, indicating a potential oversold condition. This is visually represented in the chart shared in his post, showing a pronounced dip in the RSI, signaling that BTC may be ripe for a price rebound.
“Other metrics are also showing alerts. I think now all conditions are in place to start testing the all-time high (ATH).” – Axel Adler Jr
Despite these optimistic indicators, Bitcoin has seen a decline in price over the last day, demonstrating the need for caution when analyzing such data.
On-Chain Metrics: Short-Term Holder Activity
On-chain analytics firm Glassnode provides further insights. According to their latest weekly report, the average cost basis for short-term holders (STHs)—those who purchased Bitcoin within the last 155 days—is approximately $97,100. This metric often serves as a significant psychological and technical level for traders, marking critical support and resistance zones.
Key Support and Resistance Levels
- Short-Term Holder Cost Basis: $97,100 – A level where BTC has historically faced support or resistance.
- 0.85 Quantile Level: $95,600 – Close to the STH cost basis, this level, derived from the Spent Supply Distribution (SSD) Quantiles model, indicates where currently selling investors first acquired their Bitcoin.
- Standard Deviation Bands: The -1 standard deviation band is currently at $83,200, suggesting a potential downside if bearish momentum continues.
If Bitcoin’s price continues to decline, breaching the STH cost basis may signal further bearish sentiment. However, a market retest of the quantile at $95,600 could be pivotal, providing a likely support level where buying interest might return.
Assessing Market Sentiment
Market sentiment plays a crucial role in Bitcoin’s price movement. Analysts are also monitoring broader cryptocurrency market dynamics, as movements in rival assets can impact Bitcoin’s performance. Currently, the cryptocurrency market has been facing headwinds from regulatory uncertainties and macroeconomic pressures that may influence trading activity.
Future Outlook
While the oversold RSI suggests a potential opportunity for a price rebound, Bitcoin’s ability to recover to previous highs will depend on a confluence of factors:
- Market sentiment shifts related to macroeconomic conditions.
- Investor behavior as indicated by on-chain metrics.
- Responses to any regulatory changes impacting the cryptocurrency sector.
At the time of this writing, Bitcoin trades around $101,000, reflecting a nearly 5% decline over the past week. Market participants will be closely watching developments in both Bitcoin’s performance and overall market sentiment as they navigate these challenging conditions.
Conclusion
Bitcoin’s recent RSI dip below 30 is a potential indicator that the asset could be poised for recovery. However, investors should remain vigilant, given the mixed signals from current price trends, sentiment, and on-chain data. Monitoring these developments will be essential for assessing future price trajectories for cryptocurrency in a rapidly evolving market landscape.
Featured image from Dall-E, CryptoQuant.com, Glassnode.com, chart from TradingView.com.