Dogecoin Price Could Quickly Reach $0.25 with Chart Setup
Technical Chart Analysis
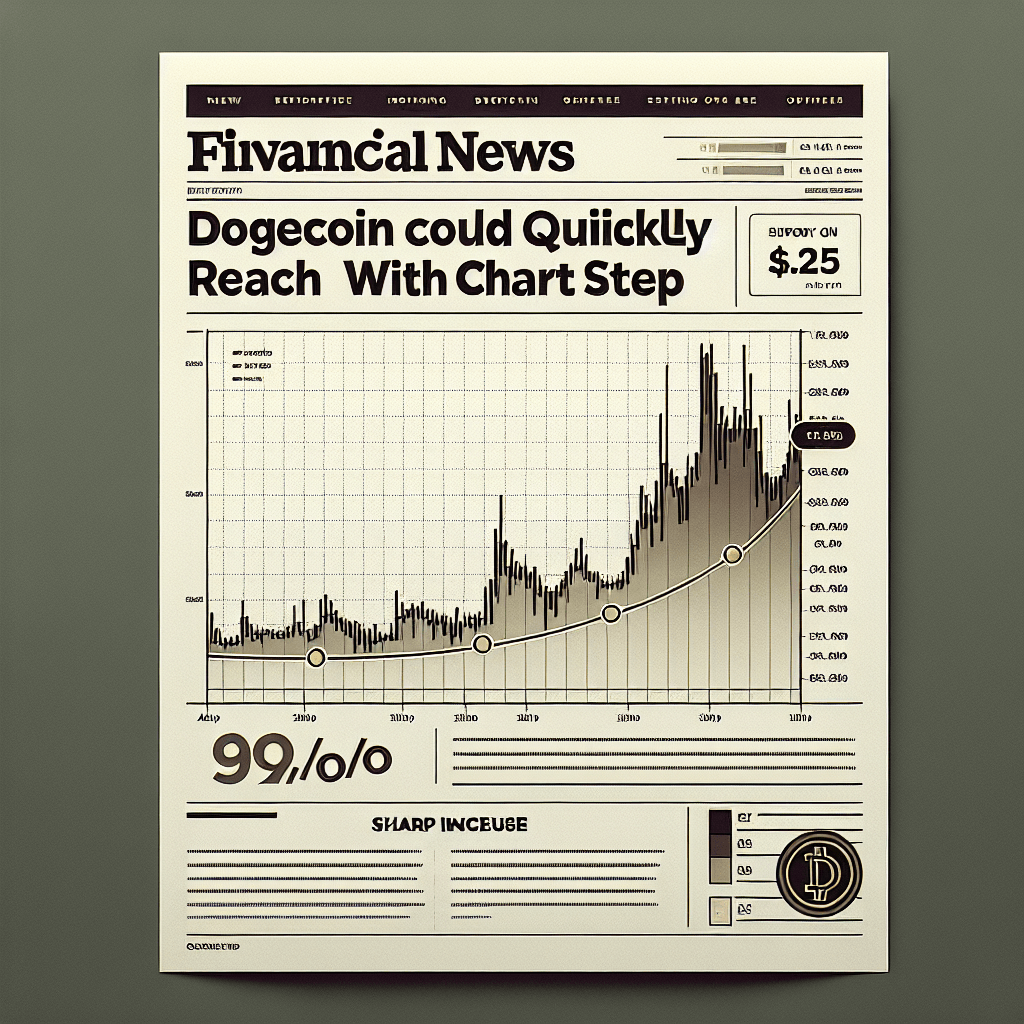
Over the past week, Dogecoin (DOGE) has retraced more than 6% on its weekly chart, dipping briefly to a low of $0.215. Yet on the 1-hour candlestick timeframe, traders have identified a classic inverse head and shoulders pattern, suggesting a potential bullish reversal. This setup typically signals that downward momentum is waning and buyers are stepping in at higher lows, forming two shoulders around a deeper central trough.
Pattern Formation and Key Levels
- Left Shoulder: Formed in early May near $0.224, marked by a local low before a brief rebound.
- Head: The deepest trough at $0.215 on May 25, confirming selling exhaustion.
- Right Shoulder: A higher low around $0.222 between May 23–24, signaling diminished selling pressure.
- Neckline: A resistance trendline drawn at approximately $0.228. A decisive break with above-average volume (20% above the 20-period average) would validate the pattern.
Crypto analyst Klejdi Cuni noted on X: “A clean break of the $0.228 neckline on DOGE/USDT could propel prices toward $0.25 in the short term.”
Short-Term Price Targets and Fibonacci Confluence
Upon a successful breakout, measurement techniques project immediate upside targets:
- First Target: $0.239 – aligns with the 38.2% Fibonacci retracement of the $0.215–$0.265 range and acted as prior support on May 22.
- Second Target: $0.25 – represents a full recovery to May’s local peak and psychological half-cent level.
If momentum persists and trading volume supports the move, DOGE could test higher confluences around $0.268 (23.6% Fib) and even $0.30, in line with the ascending channel breakout seen earlier this month. Conversely, a drop below the right shoulder at $0.222 would invalidate the pattern, risking a retest of $0.21 or lower.
On-Chain Metrics and Market Sentiment
Beyond technicals, on-chain indicators provide further context:
- Active Addresses: Santiment reports a 15% uptick in daily active Dogecoin addresses, reflecting renewed network usage.
- Whale Accumulation: Glassnode data shows top 10 DOGE addresses increased balances by 2% in the past 48 hours, signaling institutional interest.
- NVT Ratio: Dogecoin’s Network Value to Transactions ratio recently dipped below its 30-day MA, often a bullish sign after extended sideways trading.
Correlation with Bitcoin and Broader Altcoin Market
Dogecoin’s price action remains somewhat correlated with Bitcoin’s swings (correlation coefficient ~0.65 over 30 days), meaning BTC strength or weakness tends to bleed into major altcoins. Currently, Bitcoin dominance has stabilized near 52%, while the altcoin season index edges above 60%, suggesting capital rotation into higher-beta coins like DOGE could intensify if BTC holds above $65,000.
Risk Factors and Volatility Considerations
Traders should remain mindful of Dogecoin’s historically high volatility. Key risk metrics include:
- Average True Range (ATR): On the 1-hour chart, ATR stands at $0.005, implying potential one-hour swings of ~2%.
- Order Book Depth: Low liquidity below $0.222 could exacerbate sharp moves on large orders.
- Stop-Loss Placement: Consider a stop below the right shoulder at $0.220 to manage risk.
Expert Commentary and Forecasts
“If DOGE clears the neckline with conviction, it may attract short-covering flows and algorithmic buying, driving the price toward $0.25 in a matter of sessions,” says technical strategist Alex Thorn of Deribit Insights.
“On-chain trends are confirming lighter selling pressure and increased whale stacking, so a measured breakout could spark a sustained rally,” adds on-chain analyst Maya Singh from CryptoQuant.
Conclusion
Dogecoin’s emergence of an inverse head and shoulders pattern on the 1-hour chart, backed by rising volume and supportive on-chain metrics, sets the stage for a potential rebound toward $0.239 and $0.25. A clear breakout above the $0.228 neckline is crucial for confirmation; failure to hold this zone may push prices back to the $0.21–$0.22 range. Traders should weigh technical signals against broader market correlations and maintain disciplined risk management.