Shiba Inu’s Triangle Pattern Indicates Possible 17% Move
The memecoin Shiba Inu (SHIB) has been consolidating within a descending triangle on its 4-hour chart, hinting at a possible 17% breakout move. Technical analysts are closely watching the converging trendlines, while on-chain metrics and derivatives positioning add further context to the token’s near-term outlook.
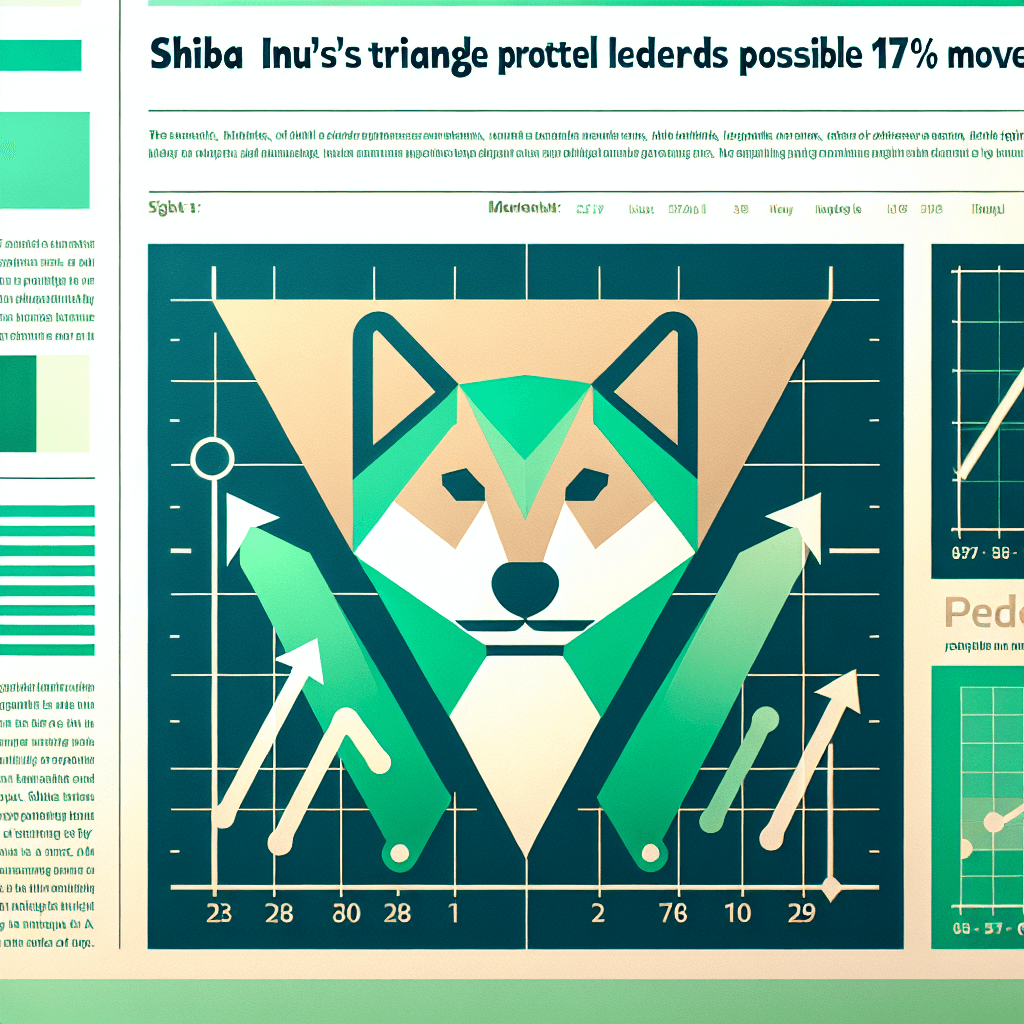
4-Hour Chart: Descending Triangle Consolidation
A descending triangle is defined by a flat or slightly sloping lower trendline acting as support and a downward-sloping upper trendline serving as resistance. Over the past two weeks, SHIB’s price has oscillated between roughly $0.0000148 and $0.0000139, compressing volatility as the pattern narrows.
Analyst Ali Martinez highlights that SHIB’s 4-hour chart shows prices trapped between two converging trendlines, indicating a classic triangle setup with a potential 17% measured move.
Triangle Mechanics and Measured Move
In technical analysis (TA), the measured move from a triangle breakout is often approximately equal to the height of the pattern at its widest point. For SHIB, this translates into a target near $0.0000173 on an upside break or around $0.0000122 on a downside breach, implying moves of roughly ±17% from current levels.
On-Chain Metrics and Burn Rate Impact
Beyond chart patterns, on-chain data offers additional insights. The Shibarium layer-2 burn dashboard reports an average daily token burn exceeding 1.2 million SHIB over the past month, modestly reducing circulating supply. Meanwhile, active wallet addresses interacting with SHIB contracts have held steady around 25,000 per day, signaling continued user engagement despite low volatility.
Derivatives Market and Open Interest
Open interest in SHIB perpetual futures on major exchanges such as Binance and OKX has risen by 8% in the last week, with a neutral funding rate near zero. Options volumes on Deribit show slight skew toward calls, suggesting market participants are hedging for an upside breakout. A sudden shift in funding rates—especially if funding turns significantly positive—could accelerate a breakout move.
Risk Management and Position Sizing
- Place stop-loss orders just below the lower trendline at $0.0000135 to limit downside risk.
- Target a reward-to-risk ratio of at least 2:1 by aiming for the measured move near $0.0000173.
- Allocate no more than 1–2% of trading capital to a single position to manage volatility inherent in memecoins.
- Monitor volume spikes and funding rate shifts for confirmation of breakout direction.
Key Levels to Watch
- Upper trendline resistance: $0.0000148
- Lower trendline support: $0.0000139
- Measured upside target: $0.0000173
- Measured downside target: $0.0000122
SHIB Price Snapshot: At the time of writing, Shiba Inu trades near $0.00001436, down roughly 2% over the last week according to CoinGecko. As the triangle tightens, traders anticipate a decisive breakout. Stay tuned for confirmation of the next major swing.
Charts from TradingView.com, on-chain data via Shibarium and Glassnode.