XRP Price Nears Key $2.00 Support: Will Bulls Take Action?
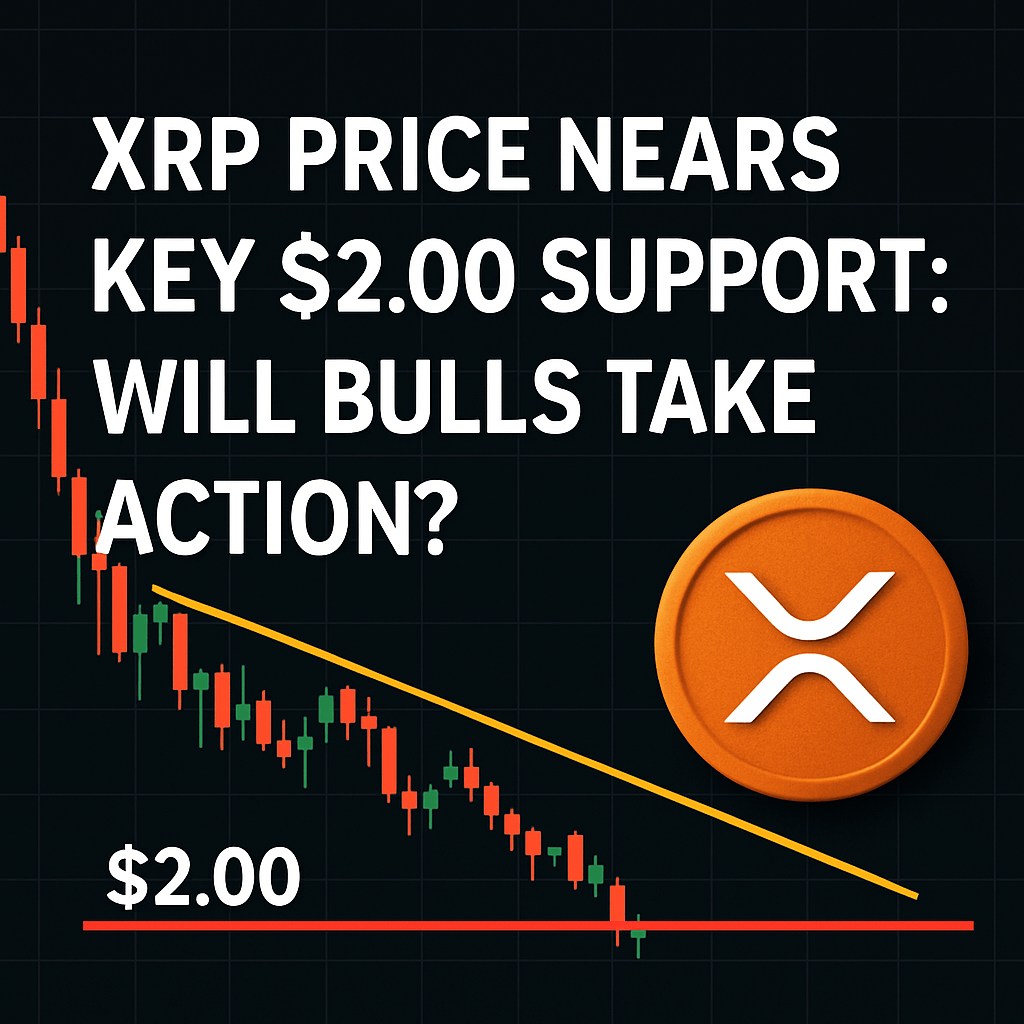
The price of XRP has recently experienced a marked decline, falling below the significant $2.20 resistance zone. Currently, XRP is consolidating its losses, trading around $2.150, and above the 100-hourly Simple Moving Average (SMA). However, it has broken below a crucial bullish trend line, which previously provided support at $2.192 on the hourly chart for the XRP/USD pair, as reflected in data from Kraken.
Current Price Action
After failing to gain bullish momentum above the $2.220 level, the XRP price initiated a fresh decline, mirroring similar patterns observed in major cryptocurrencies like Bitcoin and Ethereum. It dropped below the $0.2150 and $0.2120 levels, ultimately testing the $2.050 zone. This indicates a critical point of support, as the price remains below the 23.6% Fibonacci retracement level of the recent downturn from the swing high of $2.281 to a low of $2.056.
Resistance and Support Levels
Currently, XRP is jockeying for position below key resistance zones. The immediate resistance stands at $2.120, followed closely by a more significant challenge at $2.150. Traders should note the next resistance level at $2.1750, which aligns with the 50% Fibonacci retracement level of the aforementioned decline. A decisive breakout above $2.1750 could open the door to further gains, pushing the price toward the $2.20 resistance level and possibly even reaching $2.2420 in the near term.
Potential for Further Declines
Conversely, if XRP fails to overcome the $2.150 resistance zone, the cryptocurrency may initiate another downward trend. Immediate support is framed around the $2.050 mark, while the next significant support threshold lies near $2.020. A break and close below $2.020 may trigger a further decline, potentially retreating to $2.00. If this critical support fails, the next downside target could be around $1.920.
Technical Indicators
- Hourly MACD: The MACD for XRP/USD is currently exhibiting bearish momentum, gaining pace in the negative zone, indicating a trend continuation.
- Hourly RSI (Relative Strength Index): The RSI is presently below the neutral reading of 50, suggesting that bearish sentiment prevails among traders.
Market Sentiment and Broader Trends
The recent price movement has stirred caution among traders, especially as XRP has been unable to maintain strength amid a generally volatile crypto market. This is reflective of broader macroeconomic factors including fluctuating interest rates and regulatory uncertainties that are currently influencing investor behavior across the digital asset spectrum.
Expert Insights
Market analysts are divided on XRP’s immediate future. Some suggest that the ongoing consolidation phase may ultimately lead to a bullish reversal, particularly if support levels hold strong. Others warn that continued pressure from external market factors could hinder recovery efforts. An expert noted, “The $2.00 level is crucial; if bulls can defend this threshold, we might see renewed buying interest, but failing to hold may expand bearish sentiment further.”
Conclusion
The current price action of XRP is poised at a critical juncture. As it teeters near the $2.00 support level, the outlook remains uncertain. Traders and investors should closely monitor both technical indicators and broader market developments to better gauge potential price fluctuations in the coming days.
Key Takeaways
- XRP has dropped below $2.20 and is testing critical support levels.
- Resistance exists at $2.120 and key hurdles at $2.150 and $2.1750.
- Bearish indicators suggest caution for traders entering new positions.